Tracing Application Interactions with CockroachDB
A quick lesson on observability of transactions
Often find myself working with developers and database administrators troubleshooting how the application interacts with the database. I would like to review how CockroachDB tooling can be used to observe a few common patterns such as explicit transactions, implicit transactions, SQL statements and their execution times and performance implications.
I have set up a 3 region cluster on GCE with 3 database nodes and a client in each region. Starting with a banking application in east 1 region.
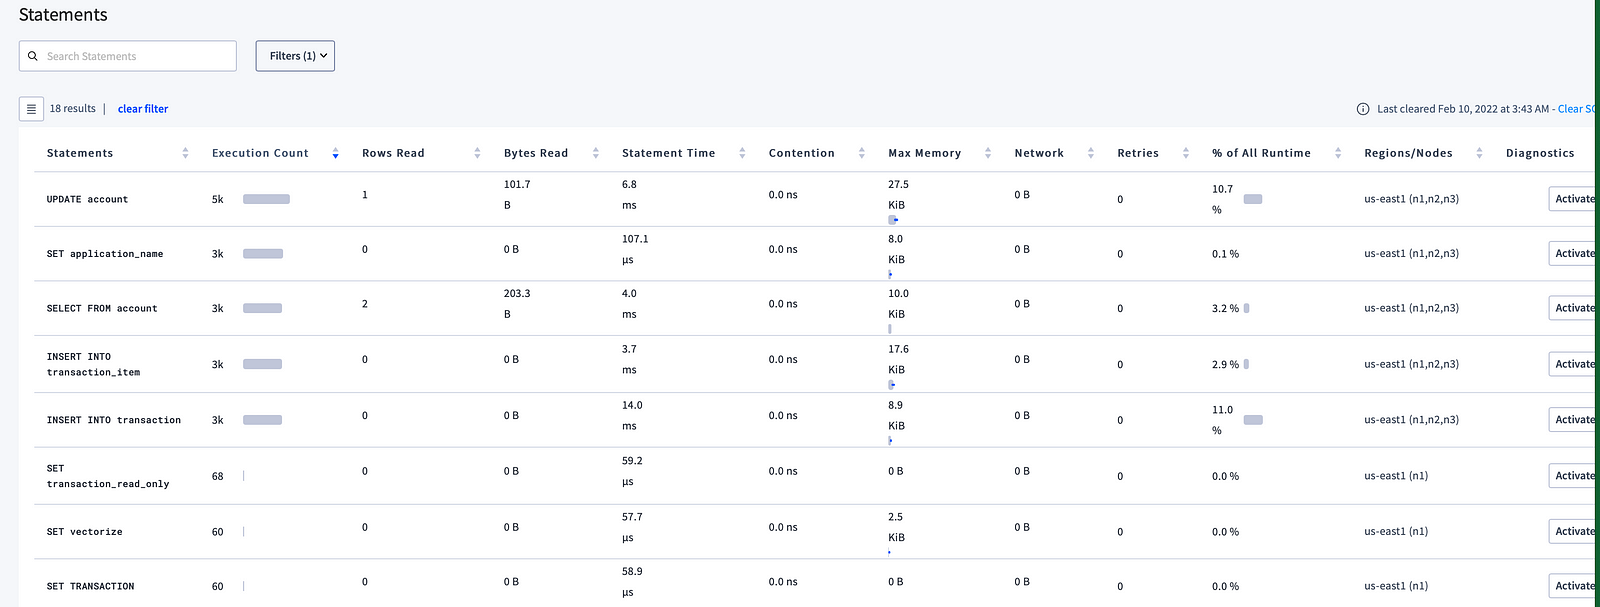
While running a client in east1, we can see the following in the CockroachDB console. The Statements page reflects SQL statements which are submitted as explicit transactions or implicit transactions. Stealing the description in the UI about transaction types, “Explicit transactions refer to statements that are wrapped by BEGIN and COMMITstatements by the client…For statements not in explicit transactions, CockroachDB wraps each statement in individual implicit transactions.” Note that SQL with Explicit transaction type employs transactional pipelining and therefore reports latencies that do not account for replication. On the flip side, a DML statement which is an implicit transaction, the latency represents the total time for the statement to complete replication [quick aside CockroachDB is consensus based].
That is sort of interesting, let’s now look at the transactions page
and drilling into the highlighted application, we can see the first explicit transaction has 5 statements each with a statement time where the transaction end to end time averages 62 ms per transaction execution. This includes all the replication overhead of all the table rows and associated indexes touched by the transaction including the begin, commit and transaction records.
The transaction details displays the statement fingerprints found on the statements page above. Let’s examine closely a few of the DML statements inserted into transaction_item.
Each statement execution time is around 6 ms. By themselves, we know this is not possible as the next closest region east4 is more than 10–15 ms away.
Since these statements are part of an explicit transaction the time for the replication will not be reflected as cost will be recorded at the top level. If I enable statement level tracing,
and execute an insert into transaction_item through a SQL session as an implicit transaction. We see the statement time reflects the cost of consensus across regions.
comparing the traces final steps we can see the difference.
Note the trace indicates the implicit commit! So far we have compared 2 types of statements with different transactions types.
Now to get trace details of the transaction, enabling set cluster setting sql.trace.txn.enable_threshold = ‘50ms’ will capture all transactions to the cockroach.log file which exceed the threshold.
extracting one of the transaction from the log file
ubuntu@drew-demo-0001:~/logs$ sed “s/.*+‹ //” txn > txn_clean
ubuntu@drew-demo-0001:~/logs$ egrep -e “ in state: Open|end|making txn commit explicit” txn_clean
and grep a few patterns, we can see the transaction steps breakdown along with the execution times
Digging into the details of this trace will require another blog but the summary above is starting point to understand the total latency of a transaction. So, we covered transaction types, how to trace or observe them and understanding their latency. By the way please check out this very neat banking application my teammate put together https://github.com/kai-niemi/roach-bank.
